Data Gathering Techniques for Analytics Pipelines
Batch, streaming, APIs, CDC, logs, and sensors: the six data gathering techniques for analytics pipelines, and when to use each one.
Most pages about data gathering techniques cover surveys, interviews, and focus groups. Those are research methods. This guide covers the engineering meaning: the six ways an analytics pipeline gets data out of databases, SaaS tools, event streams, and devices and into a warehouse.
The six techniques are batch extraction, streaming ingestion, API pulls, change data capture, log and event collection, and sensor data. The choice between them comes down to four questions: how fresh the data must be, how much load the source can take, whether you need deletes and history, and how much operating work you want to carry.
What are data gathering techniques in an analytics pipeline?
Data gathering techniques are the methods a pipeline uses to extract or receive data from operational databases, SaaS tools, event producers, and devices, and load it into an analytics destination such as a warehouse. They differ in one thing: how new data becomes available to you.
Every technique falls into one of three groups. You pull data on a schedule, which covers batch extraction and API pulls. The source pushes data to you as it happens, which covers event streams, webhooks, and sensors. Or you read the database's own change log, which is change data capture.
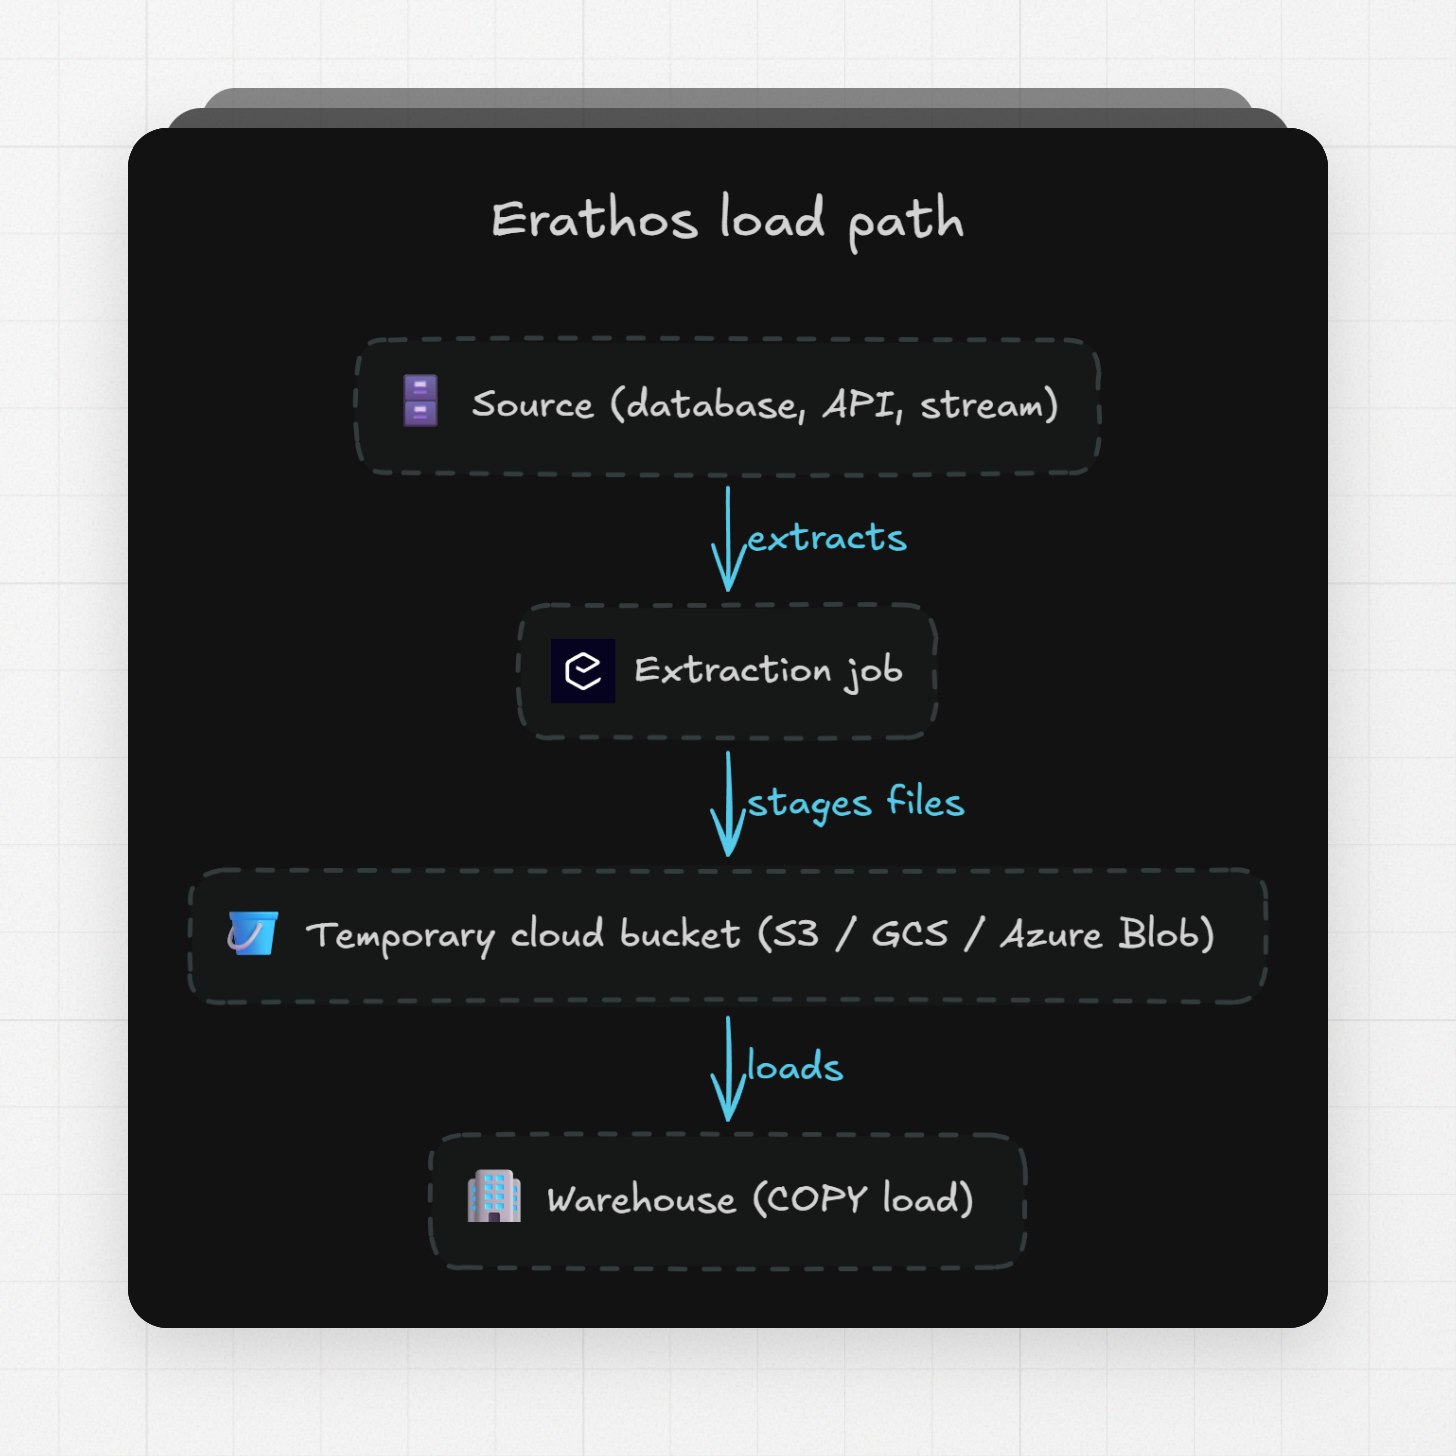
The load side looks the same no matter how you capture. In Erathos pipelines, each job extracts data from the source, stages it in a temporary cloud bucket (S3, GCS, or Azure Blob Storage), loads it into the warehouse with a COPY command or equivalent, and then deletes the temporary files.
How do batch extraction and streaming ingestion differ?
Batch extraction pulls data from the source on a schedule and loads it in chunks. Streaming ingestion receives each event as it happens and processes it right away. The question behind the choice is how fresh the data needs to be.
Batch fits reporting that runs on a clock: daily sales reports, monthly payroll, nightly loads. In Erathos, you choose the sync frequency per job, so the same connector can run at intervals of minutes, hours, or days. Streaming fits work that reacts to single events: fraud checks, live dashboards, device monitoring.
The operating cost differs too. A batch job runs and exits. A streaming pipeline keeps a broker and its consumers running around the clock, so there is more to watch and more to pay for when the dashboard it feeds is only read once a morning.
When should you gather data through an API?
An API pull fits sources that only expose data through HTTP endpoints, which covers most SaaS tools, the software you subscribe to like HubSpot or Shopify. The pipeline pages through results, saves a cursor so the next run continues where it stopped, and stays under the vendor's rate limits.
Rate limits shape the whole design. Shopify's GraphQL Admin API charges every query a point cost and grants 100 to 2,000 points per second depending on the plan. One query can't cost more than 1,000 points, pagination stops at 25,000 objects, and the recommended wait after a throttled request is one second. For large fetches Shopify points to bulk operations, which skip the per-query cost limit.

Shopify's rate limits by plan, from the Shopify API usage docs
HubSpot gives private apps 100 to 190 requests per 10 seconds and 250,000 to 1,000,000 calls per day depending on the tier. Go over and every later call returns a 429 error. HubSpot's own advice is to throttle, cache repeated data, use batch endpoints, and switch to webhooks for updated records.
Every vendor invents its own pagination, cursor rules, and error format, so per-source code piles up fast. Managed connectors take that work over: Erathos maintains 139 connectors with automatic retries, schema drift detection, and alerts when a run fails. For internal APIs there are custom connectors, with the connector code kept in a GitHub repository.
When is change data capture better than polling a database?
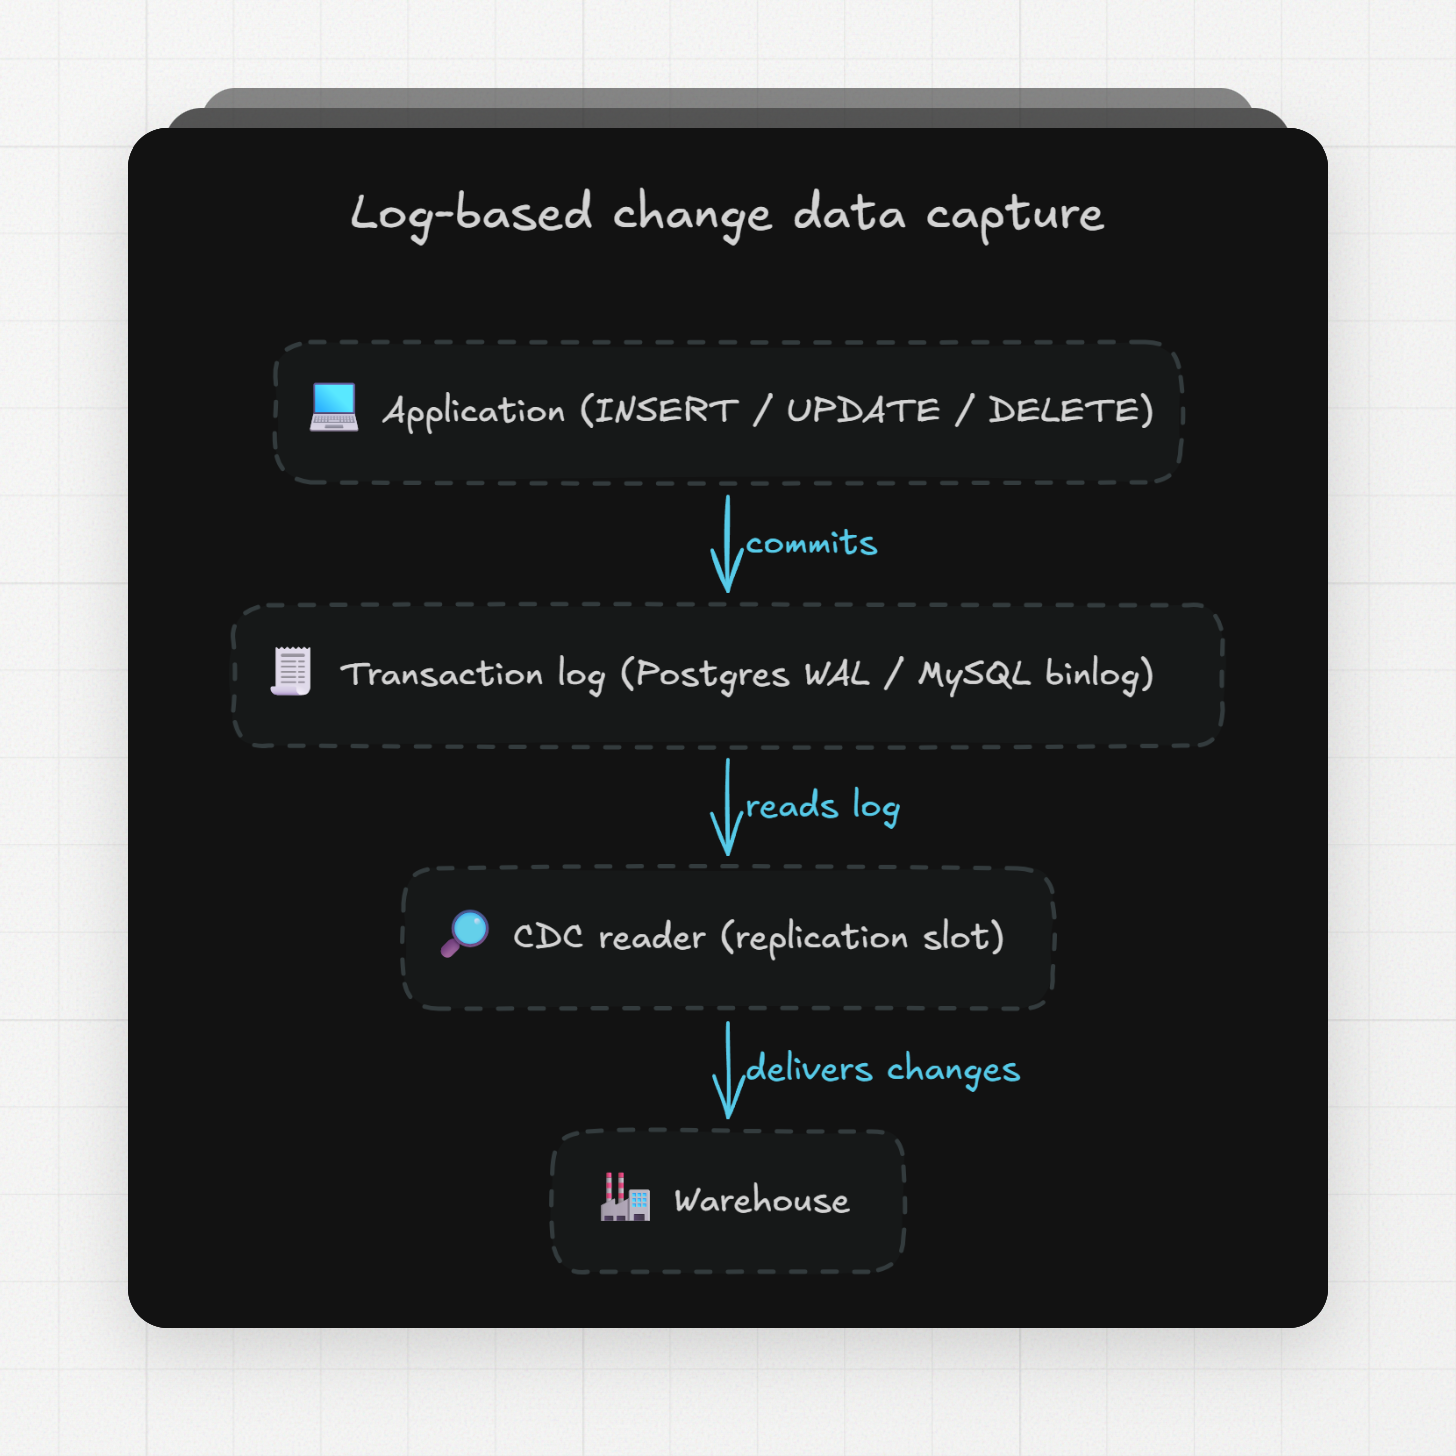
Change data capture (CDC) wins when you need deleted rows, the history of every change, or when the table is too big to scan on a schedule. Polling re-queries the table. CDC reads the database's transaction log.
Cursor-based polling stores the highest value found so far in a column like an update timestamp and asks for newer rows on the next run. It has two blind spots. A DELETE removes the row instead of updating a column, so a deleted row never shows up in a cursor query. And a row that changes several times between runs shows up only in its final state.
CDC reads the log where the database records every committed change: the write-ahead log (WAL) in PostgreSQL, the binary log (binlog) in MySQL. Here is what that log holds. On PostgreSQL 15 we created a logical replication slot with the built-in test_decoding plugin, ran an insert, an update, and a delete, then read the slot:
CREATE TABLE orders (id int PRIMARY KEY, status text);SELECT * FROM pg_create_logical_replication_slot('demo', 'test_decoding');INSERT INTO orders VALUES (1, 'created');UPDATE orders SET status = 'paid' WHERE id = 1;DELETE FROM orders WHERE id = 1;SELECT data FROM pg_logical_slot_get_changes('demo', NULL, NULL);
BEGIN 725table public.orders: INSERT: id[integer]:1 status[text]:'created'COMMIT 725BEGIN 726table public.orders: UPDATE: id[integer]:1 status[text]:'paid'COMMIT 726BEGIN 727table public.orders: DELETE: id[integer]:1COMMIT 727
All three operations are there, in commit order, including the delete that no cursor query can see. The DELETE line carries only the primary key. That comes from the table's default replica identity, one of the settings the next section covers.
CDC and streaming are separate decisions: one is how you capture, the other is how often you deliver. A CDC pipeline that runs once an hour still captures everything that happened, while a batch sync that runs once a minute only shows the latest snapshot each time. You can read the log continuously or on a schedule; as long as the log is retained, nothing between runs is lost.
What must be configured for PostgreSQL and MySQL log-based CDC?
PostgreSQL needs wal_level set to logical, capacity for replication slots and WAL senders, and a limit on retained WAL. MySQL needs row-based binary logging with full row images, replication privileges, and binlog retention long enough to survive downtime.
The Erathos PostgreSQL setup checks these values:
wal_level = logicalmax_replication_slots = 10 ; or highermax_wal_senders = 10 ; or highermax_slot_wal_keep_size = '5GB'
The first three need a database restart; the last one hot-reloads. It also matters most in production: with the default of -1, a replication slot may retain an unlimited amount of WAL. If nothing reads the slot, WAL files pile up on disk until you set a ceiling or drop the slot.
By default, update and delete events log only the primary key, which is why the DELETE line in the demo above carried only the id. Setting REPLICA IDENTITY FULL on the table makes the log carry the whole old row. Same slot, after the change:
ALTER TABLE orders REPLICA IDENTITY FULL;INSERT INTO orders VALUES (2, 'created');DELETE FROM orders WHERE id = 2;SELECT data FROM pg_logical_slot_get_changes('demo', NULL, NULL);
BEGIN 728COMMIT 728BEGIN 729table public.orders: INSERT: id[integer]:2 status[text]:'created'COMMIT 729BEGIN 730table public.orders: DELETE: id[integer]:2 status[text]:'created'COMMIT 730
The delete now carries the full old row, so the warehouse gets the exact record of what disappeared.
MySQL needs binary logging in ROW format with FULL row images; without those, update and delete events don't carry the complete before and after state of the row.
log_bin = mysql-binbinlog_format = ROWbinlog_row_image = FULLbinlog_expire_logs_seconds = 864000 ; 10 days
The CDC user needs the SELECT, RELOAD, SHOW DATABASES, REPLICATION SLAVE, and REPLICATION CLIENT privileges, plus a unique numeric server ID. Retention sets how much downtime the pipeline survives: MySQL purges binlog files after a set window, 30 days by default, and once a file CDC still needed gets purged, the connection has to take a fresh initial snapshot to recover.
How do logs, events, and webhooks collect analytics data?
In log and event collection, the producer pushes each event to a broker or an HTTP endpoint the moment it happens, and the pipeline consumes from there. Kafka topics and webhooks are the two common shapes.
Kafka is an open-source distributed streaming system used for stream processing, real-time data pipelines, and data integration. By default it delivers at-least-once: a message arrives one or more times, because a producer that never got an acknowledgment retries and can write the same message to the log twice.
At-least-once means the warehouse side has to handle repeats. The standard fix is writing each event keyed by a primary key or an event ID, so a duplicate overwrites the same record instead of adding a second row.
Webhooks are the same push model over plain HTTP: the vendor calls your endpoint when a record changes. HubSpot recommends webhooks over polling for picking up updated records, and its workflow webhook calls don't count against API rate limits.
How do sensors and IoT devices gather data for analytics?
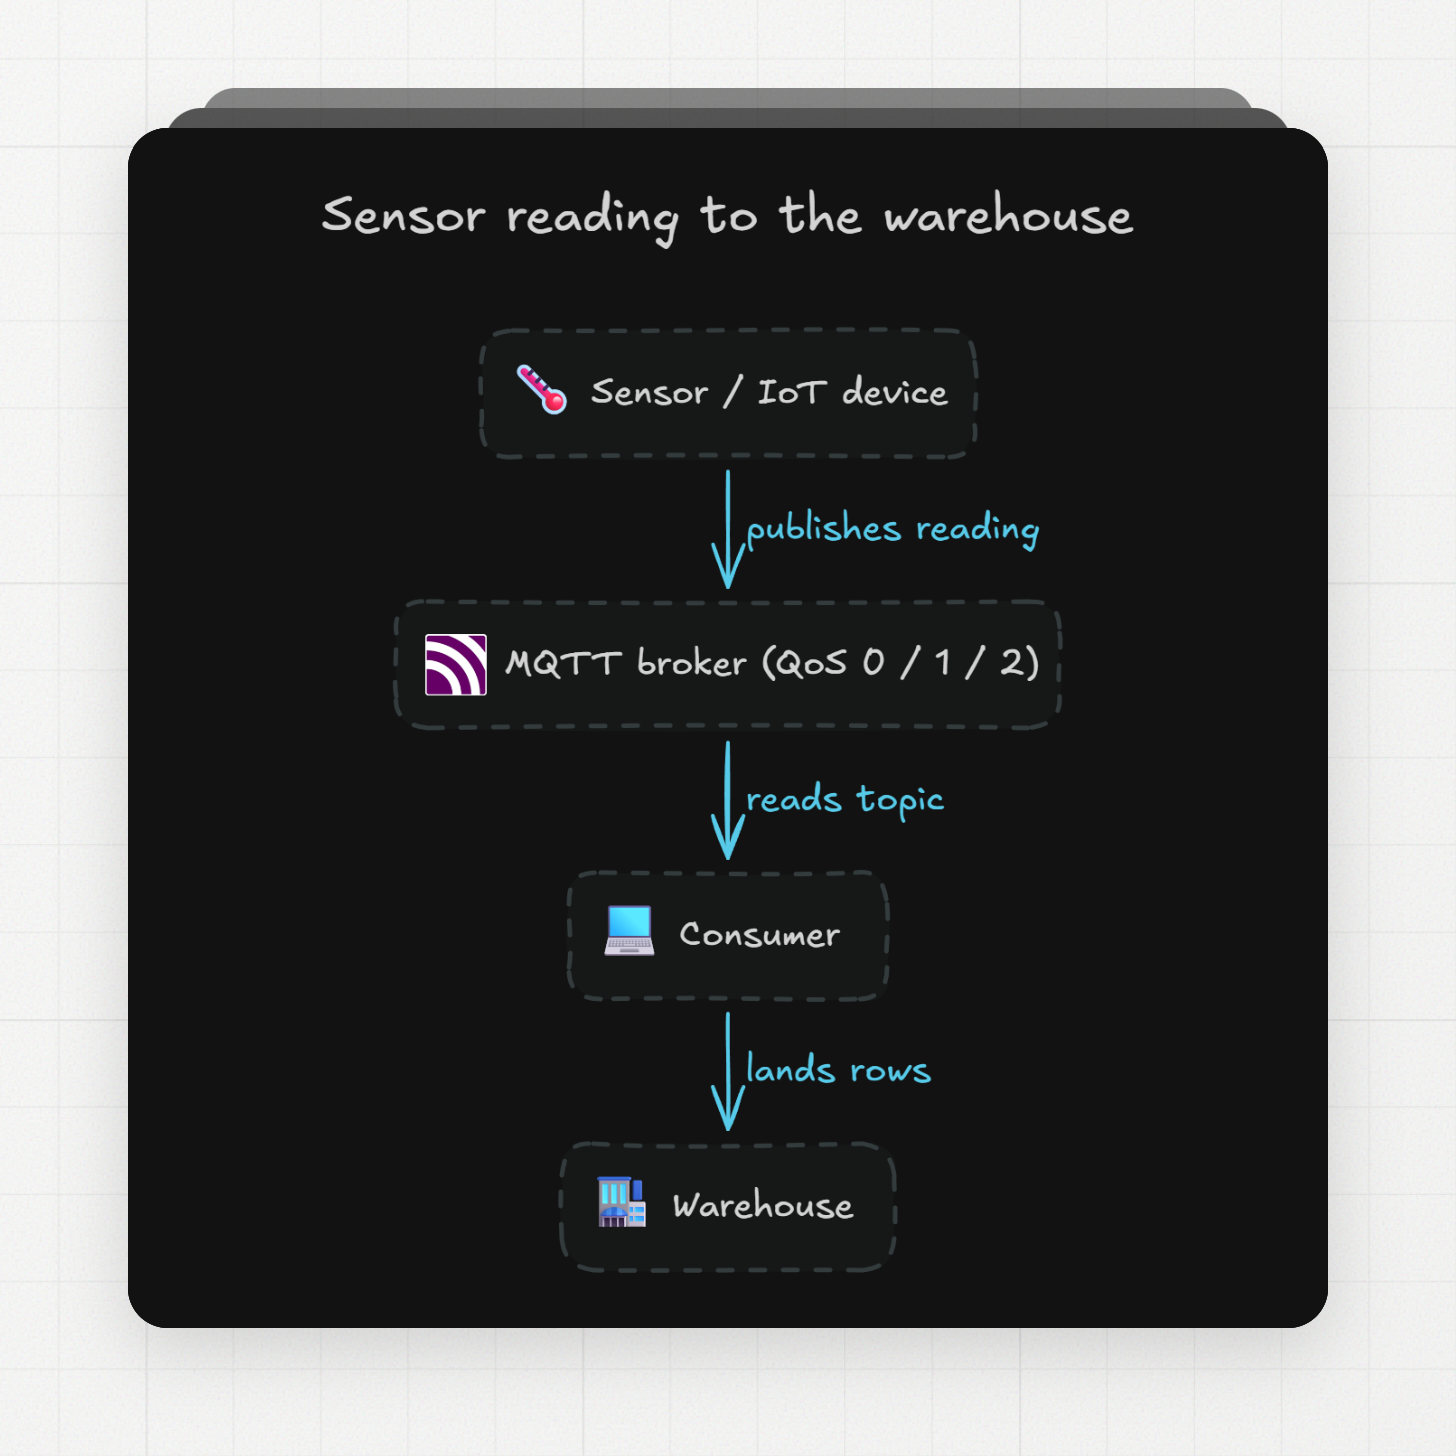
Sensors and IoT devices publish readings to a broker over MQTT, a publish/subscribe messaging protocol built for machine-to-machine and Internet of Things settings where bandwidth is scarce and device code must stay small.
MQTT offers three quality-of-service (QoS) levels. QoS 0 delivers at most once, which fits ambient sensor readings, since a lost value is replaced by the next one seconds later. QoS 1 delivers at least once and can duplicate. QoS 2 delivers exactly once, with the most protocol overhead, and fits data like billing events.
The broker only gets readings off the device. A consumer still has to read the topics and land rows in the warehouse, and at QoS 1 the same keyed-write rule from the Kafka section applies.
Which data gathering technique should you choose?
Choose per source by answering four questions: how fresh the data must be, how much load the source can take, whether deletes and history matter, and how much operating work the technique brings.
Technique | How data becomes available | Deletes and history | Load on the source | Setup and operations |
|---|---|---|---|---|
Batch full extract | Scheduled pull of the whole table | Deletes reflected after each full load; no history between loads | Full table scan every run | Easiest |
Cursor-based incremental | Scheduled pull of rows past the last cursor | Misses deletes and in-between states | Light, needs an update column you can trust | Easy |
Log-based CDC | Reads the transaction log | Captures inserts, updates, and deletes in order | Light after the initial snapshot | Database config plus slot and binlog monitoring |
API pull | Scheduled HTTP requests with pagination | Whatever the endpoint exposes | Limited by vendor rate limits | Cursor state, retries, backoff |
Events and webhooks | Producer pushes each event | Only events the producer emits; duplicates possible | None on the source database | Broker or endpoint plus keyed writes |
Sensor data (MQTT) | Devices publish to a broker | Readings only; loss or duplicates depend on QoS | None | Broker plus a consumer into the warehouse |
Techniques combine per source: CDC for the production database, API pulls for the SaaS tools, events from the product. A single Erathos job picks its mode per connection, batch updates, cursor-based incremental loads, or CDC, so the mix is a decision made per table and per vendor.
What failure modes should every ingestion pipeline monitor?
The failures to watch are stalled replication slots, purged binlogs, overrun batch windows, API throttling, and duplicate delivery. Each one has a cheap check.
- Retained WAL per slot. A Postgres slot nothing reads retains WAL without limit under the default settings. Query retained WAL per slot and drop slots that have no consumer.
- Binlog position vs retention. Watch how far the CDC reader trails the oldest kept binlog file. Downtime longer than retention means a full new snapshot.
- Batch overruns. A full refresh of a large table may not fit its scheduling window. Compare run duration against the schedule interval; Erathos run history records duration, request counts, cursor usage, and retries per run.
- API throttling. Count 429 responses and persist the cursor after every page, so a throttled run resumes where it stopped.
- Duplicate events. At-least-once delivery repeats messages. Alert when the same event ID lands twice in a table that should be unique.
- Cursor drift. Rows deleted at the source stay in the warehouse under cursor sync. A periodic full refresh reconciles them, or CDC removes the problem at capture time.
Try Erathos free for 14 days
You can set up any of the techniques in this guide, batch, cursor-based incremental, or CDC, with a managed connector instead of custom code. Try Erathos free for 14 days and connect your first source.