Best Data Analytics Tools in 2026: Full Comparison
Tableau, Power BI, Looker, Sigma, and ThoughtSpot compared for 2026: pricing, features, and which analytics tool fits your team.
Tableau, Power BI, Looker, Sigma, and ThoughtSpot all put charts and answers on top of a cloud data warehouse. They differ in where queries run, who maintains the metric definitions, and what a seat costs. This comparison uses each vendor's official pricing pages and docs, current as of September 2026.
What are the best data analytics tools in 2026?
The best data analytics tools in 2026 are Tableau, Power BI, Looker, Sigma, and ThoughtSpot. Tableau is best for visual dashboards, Power BI for Microsoft shops, Looker for metrics managed as code, Sigma for spreadsheet-style work on the warehouse, and ThoughtSpot for natural-language search.
All five run SQL against your data. The comparison here is about the platform on top of it: the interface analysts work in, the query path, the license model, and the AI features each vendor shipped.
Tool | Public starting price | Best fit |
|---|---|---|
$15 per user/month (Viewer, Standard plan, billed annually) | Visual dashboards and exploratory analysis | |
$14 per user/month (Pro, paid yearly) | Teams already on Microsoft 365 and Fabric | |
Contact sales (annual platform plus user pricing) | Metric definitions managed as code | |
Contact sales | Spreadsheet-style analysis on the warehouse | |
$25 per user/month (billed annually, 5 to 50 users) | Natural-language search and embedded analytics |
How do Tableau, Power BI, Looker, Sigma, and ThoughtSpot compare at a glance?
The biggest split between the five is the query path. Sigma and ThoughtSpot query the warehouse directly, Looker queries your database through its LookML model, Tableau lets you pick a live connection or a local extract, and Power BI loads data into a model with per-license memory limits.
Tool | Query path | AI feature | Deployment |
|---|---|---|---|
Tableau | Live connection, or a compressed extract snapshot | Tableau Pulse included; Tableau Agent in Cloud+ | Tableau Cloud (SaaS) |
Power BI | Data model with a 1 GB (Pro) or 100 GB (PPU) memory limit | Copilot, needs paid Fabric or Premium capacity | Microsoft cloud / Fabric |
Looker | Queries your database through the LookML semantic layer | Gemini in Looker (several features in Preview) | Google-hosted only |
Sigma | Runs queries on your warehouse's own compute | Sigma Assistant and AI formula help | SaaS on top of your warehouse |
ThoughtSpot | Live pre-built connections to Snowflake, Databricks, Redshift | Spotter AI agent | SaaS |
Two costs never show up in these price cards: the warehouse compute that direct-query tools consume, and the capacity or token fees behind the AI features. Both belong in the evaluation, and each product section below spells out its version of them.
Is Tableau the best data analytics tool for visualization and exploratory dashboards?
Yes, when the team's main output is hand-built visual dashboards. Tableau Cloud Standard starts at $15 per user per month billed annually for Viewers, and any deployment needs at least one Creator seat at $75. Tableau Pulse, the AI metric feed, comes with both Cloud plans.
Tableau prices by role, and the role prices are what you compare against other tools:
Role | Standard | Enterprise |
|---|---|---|
Creator | $75 per user/month | $115 per user/month |
Explorer | $42 per user/month | $70 per user/month |
Viewer | $15 per user/month | $35 per user/month |
Enterprise adds Advanced Management, Data Management, ten sites, and eLearning. Tableau Agent, the newer assistant, comes with the Cloud+ bundle, and that one is contact-sales.
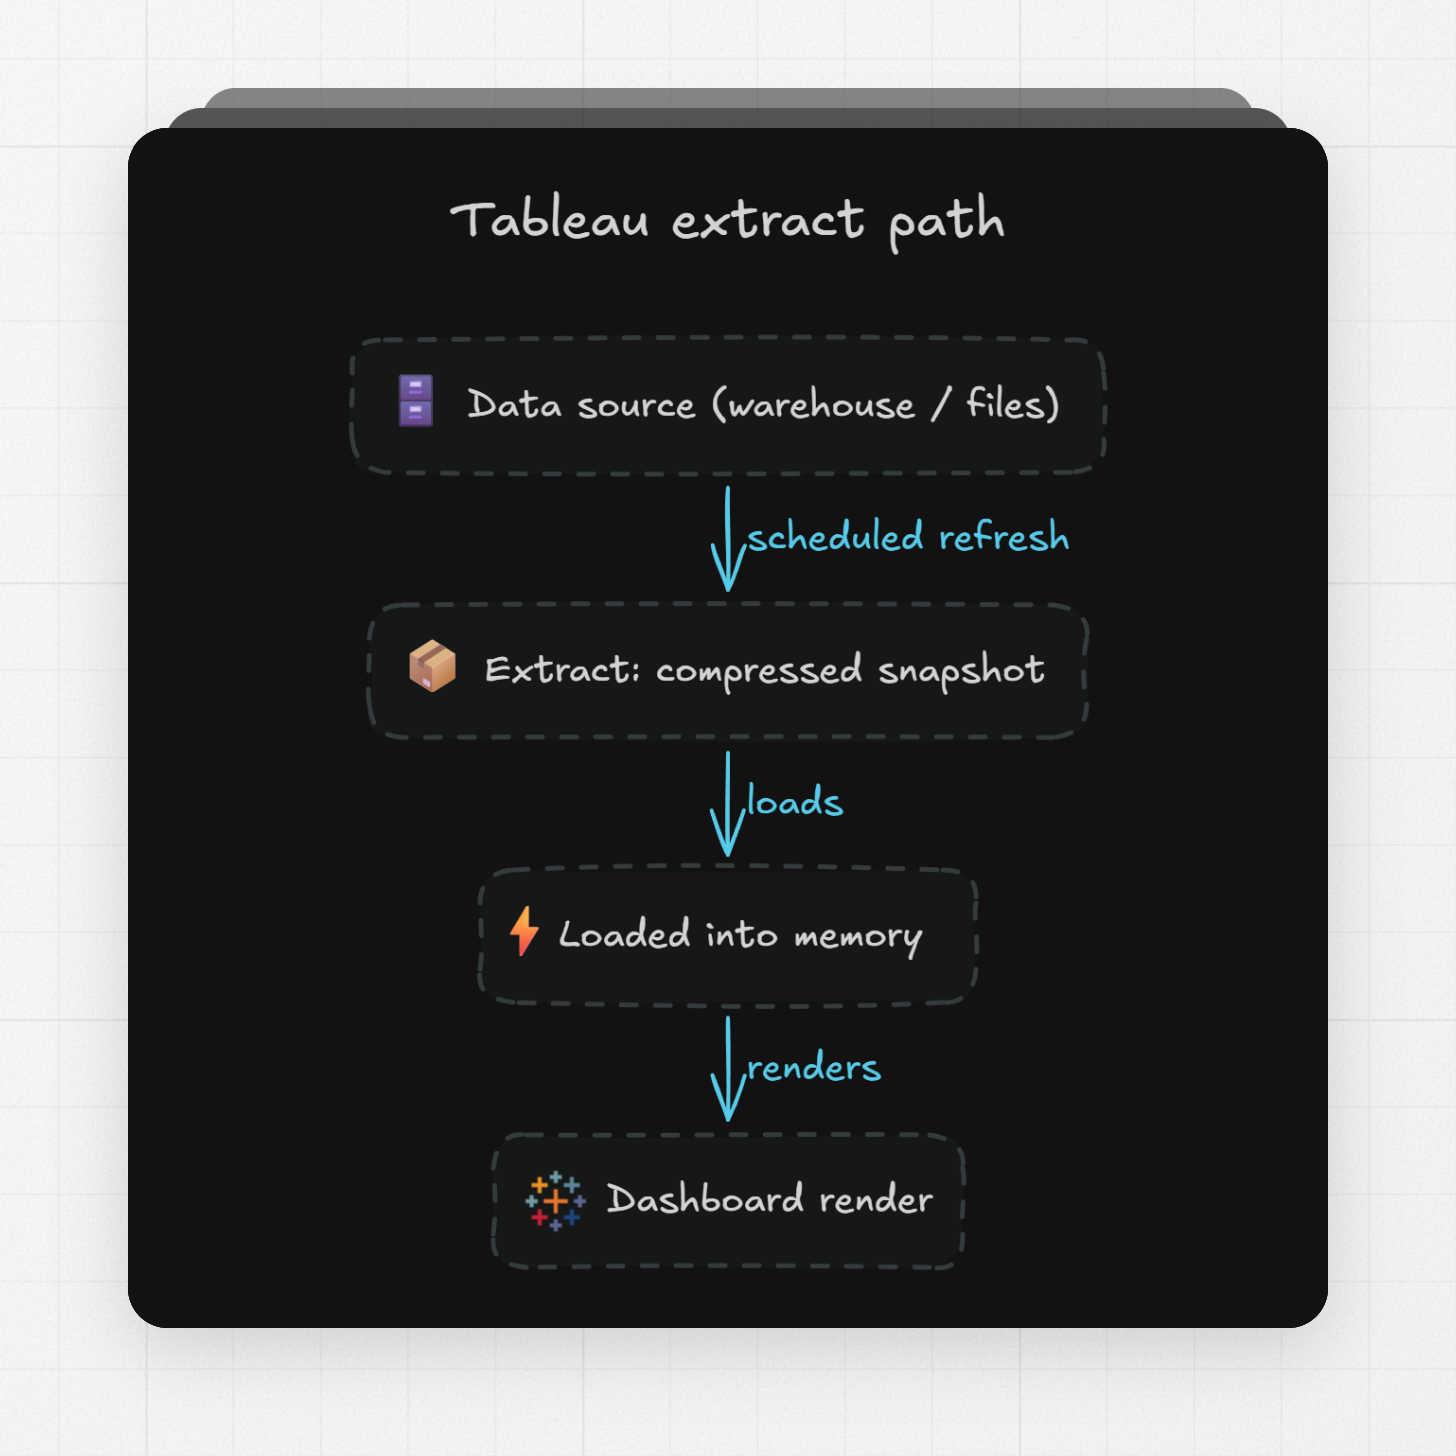
Tableau connects to data in two modes. A live connection sends queries straight to the source. An extract is a compressed snapshot stored locally and loaded into memory to render the visualization, and Tableau's stated main reason to use one is slow query execution. Extracts make dashboards fast, but they're only as fresh as the last refresh. Refresh schedules belong on your evaluation checklist.
Is Power BI the best data analytics tool for Microsoft and Fabric teams?
Yes, and it has the lowest published seat price of the five: Pro costs $14 per user per month paid yearly, Premium Per User costs $24. The limits decide which one you need more than the price does.
Pro | Premium Per User (PPU) | |
|---|---|---|
Price | $14 user/month, paid yearly | $24 user/month, paid yearly |
Model memory limit | 1 GB | 100 GB |
Refreshes per day | 8 | 48 |
Storage | 10 GB per license | 100 TB |
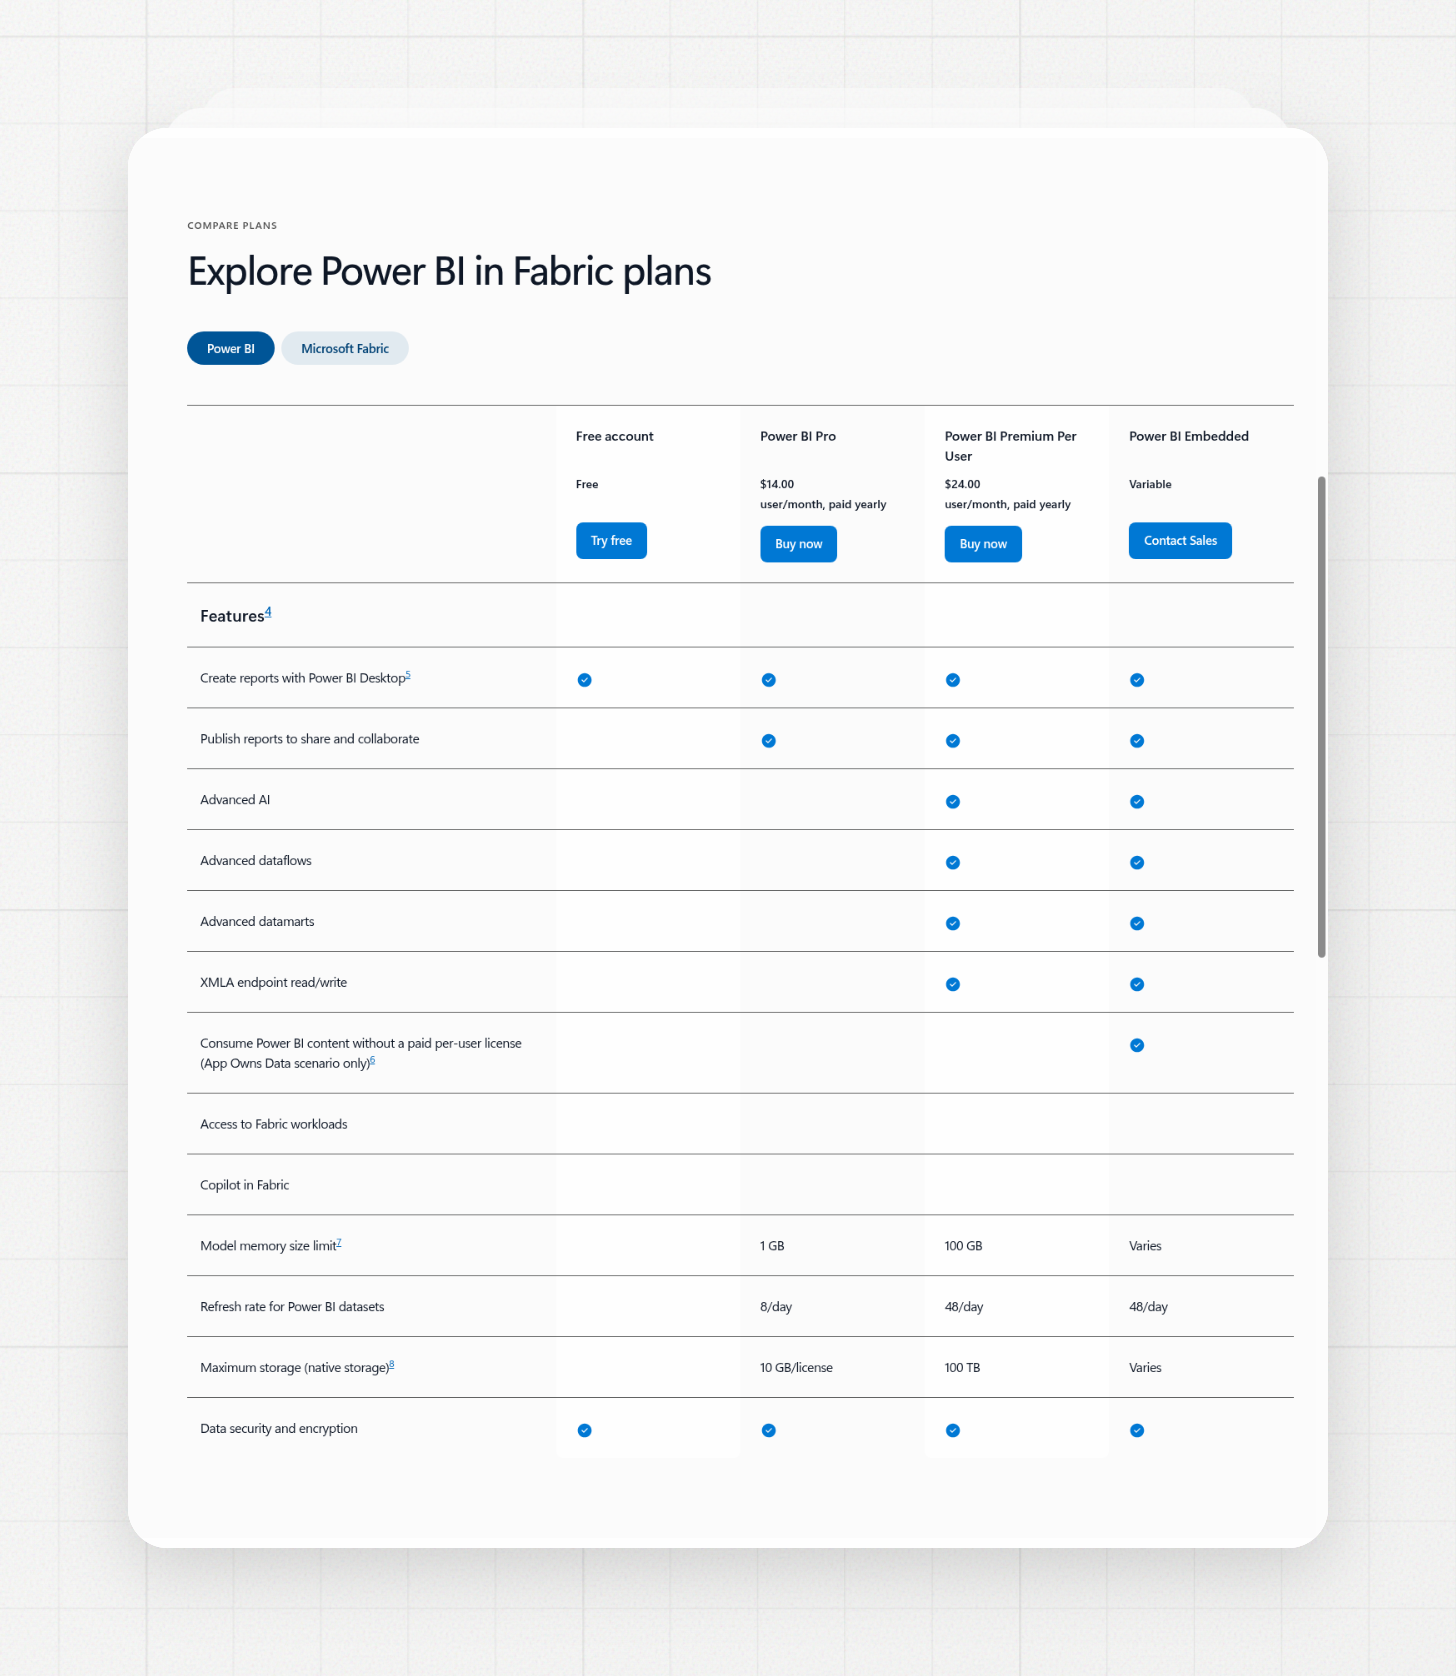
Power BI Pro vs Premium Per User limits, from Microsoft's pricing page
One licensing rule catches teams at rollout: anyone who opens content in a PPU workspace needs a PPU license too, including embedded content served through that model. Upgrading the authors alone is cheap. Upgrading the audience is the real line item.
Copilot is a separate budget line. It needs paid Fabric capacity (F2 or higher) or Power BI Premium (P1 or higher); a Pro or PPU seat alone doesn't include it, and trial capacities don't count. The Copilot report pane is generally available, while the standalone agent experiences are still in preview. When a question matches the semantic model, Copilot answers from that model. Otherwise it falls back to the general knowledge of the large language model (LLM) behind it, so the quality of the semantic model decides how consistent the answers are.
Is Looker the best data analytics tool for governed metrics and embedded analytics?
Yes, when you want each metric defined once, in code, and reused across dashboards, the API, and embedded apps. Looker pricing is annual and sold through sales across the Standard, Enterprise, and Embed editions. Each edition includes ten standard users and two developer users.
The code is LookML, Looker's modeling language. Setting up an instance means connecting the database, writing LookML, and preparing the model before anyone charts data, so plan for implementation work before the first dashboard ships. Looker (Google Cloud core) runs only as a Google-hosted service in Google Cloud; you can't host it yourself or run it in another cloud.
Gemini in Looker covers natural-language questions, LookML generation, formula help, and a code interpreter. Several of those features are still in Preview, and preview features generally fall outside formal compliance certification. Conversational Analytics tokens run without quota limits through September 30, 2026. From October 1, 2026, quotas and overage billing apply at $3 per million input tokens and $20 per million output tokens. If you evaluate Looker now, price next year's AI usage into the contract.
Is Sigma the best data analytics tool for spreadsheet-style analysis on a cloud warehouse?
Yes, for analysts who think in spreadsheets but work on warehouse-scale data. Sigma queries the cloud warehouse directly, using the warehouse's compute, security, and governance without copying data out. Sigma publishes no license prices; all four license tiers are contact-sales.
The tiers are View, Act, Analyze, and Build. View users can ask Sigma Assistant questions in natural language. Act adds input-table editing and actions. Analyze adds ad hoc analysis and the AI formula assistant. Build adds workbook creation, data modeling, connection management, SQL, and Python.
The architecture cuts both ways. Nothing gets copied, so governance stays in one place and data is as fresh as the warehouse. It also means queries and AI processing run on your warehouse compute, so the real cost of Sigma is the license plus the warehouse bill it generates. Run the proof of concept against production-sized data and watch those compute charges.
Is ThoughtSpot the best data analytics tool for search and AI analytics?
Yes, when the goal is business users typing questions in plain language instead of waiting on a dashboard queue. Published pricing starts at $25 per user per month billed annually, for teams of 5 to 50 users and up to 25 million rows of data.
Plan | Price | Limits |
|---|---|---|
User-priced | $25 per user/month, billed annually | 5 to 50 users, 25M rows |
User-priced Pro | $50 per user/month, billed annually | Up to 1,000 users, 250M rows |
Usage-priced | $0.10 per credit | Up to 1,000 users, 250M rows |
Enterprise | Custom | Unlimited users and data |
Spotter is ThoughtSpot's analytics agent. It translates questions into search tokens grounded in the semantic layer rather than generating SQL straight from the text, so you can trace and audit the query behind each answer. ThoughtSpot doesn't meter or charge for LLM tokens, though if you bring your own LLM provider, that provider's fees still apply. The plan grid also lists Unlimited Spotter as an add-on, so confirm during the sales call exactly which Spotter usage your tier includes.
What should a team test before choosing a data analytics platform?
Run the proof of concept on your own warehouse, with your own metrics, and with questions you already know the answers to. The price cards above leave out warehouse compute, AI capacity fees, refresh limits, and viewer licensing, and those decide the real bill.
The checklist that falls out of this comparison:
- Live or copied data: if the tool copies (Tableau extracts, Power BI models), test the refresh schedule against how fresh your reports need to be, and check the refresh limits for that plan.
- Metric definitions: decide who writes and maintains them, whether that's LookML files, a Power BI semantic model, or ThoughtSpot's semantic layer.
- Seat math: price the viewers, since that's most of the company, using the role prices and the PPU workspace rule described above.
- AI access: check what the AI feature needs on top of the seat (Fabric capacity for Copilot, Looker token billing from October 2026, the Cloud+ bundle for Tableau Agent).
- Warehouse compute: for Sigma, ThoughtSpot, Looker, and live Tableau connections, the query bill lands on your warehouse, so measure it during the trial.
- Row-level security: build one restricted view per candidate tool and confirm the same user sees the same rows in each.
Test the AI features hardest. In a text-to-SQL benchmark on real business questions, one model scored 93% on simple aggregations but 4% on arithmetic reasoning and 31% on grouped ranking. Whatever AI layer you buy, run it on questions with known answers before anyone trusts it in a meeting.
Why is the data pipeline behind a BI tool part of the buying decision?
Because a BI tool can only query data that already landed in the warehouse. If last night's load failed, the best dashboard on this list shows yesterday's numbers, and so does the AI agent on top of it.
That loading layer is what Erathos manages: extraction, scheduling, and loading between your business tools and your warehouse, with destinations including BigQuery, Snowflake, Databricks, Redshift, ClickHouse, and PostgreSQL. Each sync extracts from the source, stages the data in temporary cloud storage, loads it into the warehouse, then deletes the temporary files.
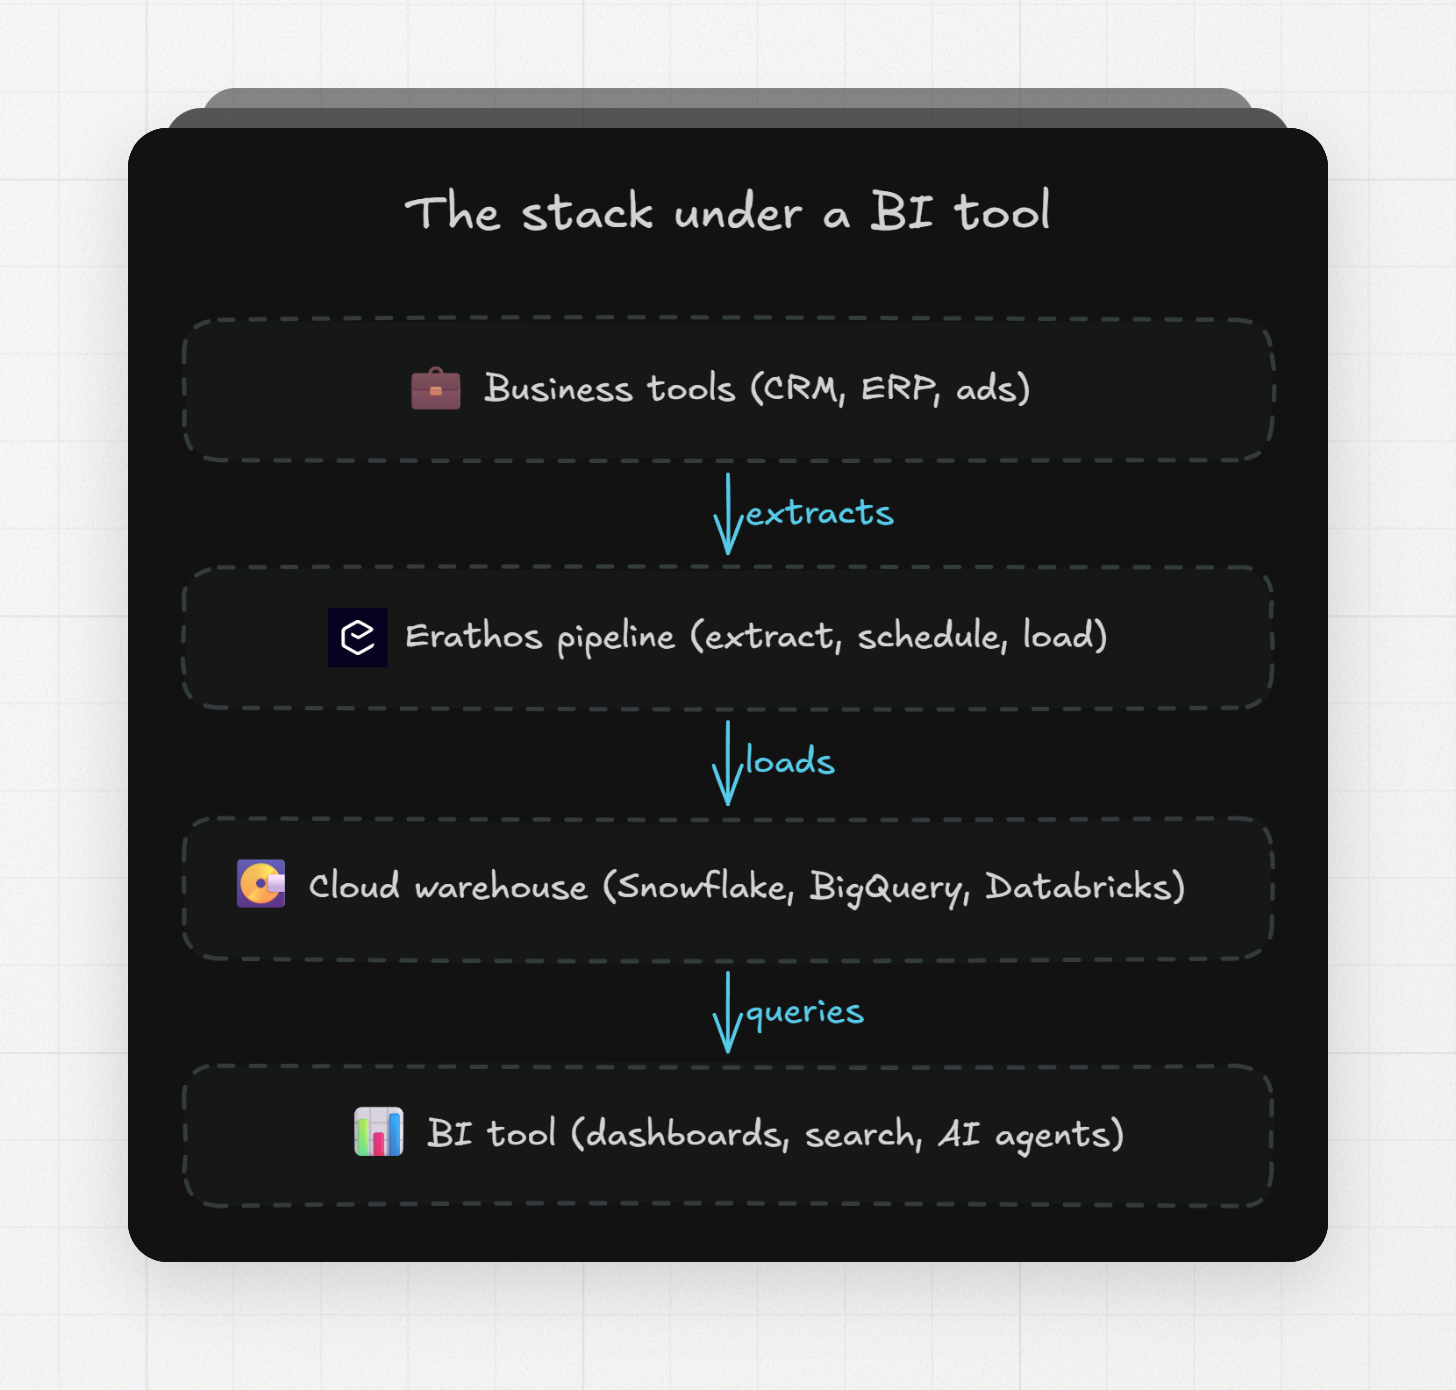
Whichever BI tool wins your evaluation, it queries the same warehouse, so the pipeline decision outlasts the BI decision. We wrote a guide on building and managing data pipelines, and if you're deciding whether to transform data before or after loading it, we compared ETL and ELT for exactly this setup.
Try Erathos free for 14 days: connect a source, pick your warehouse destination, and have fresh data loading before your BI trial starts.